


How do I use the QC metrics missed cleavages chart?
This chart shows the distribution of missed cleavages per identified peptide ion. Unlike the Overview version, this chart shows these data for every run in the current experiment design individually, grouped by condition. The mean value of missed cleavages over all the peptide ions in a run is plotted for each run. This chart is plotted assuming that proteins were treated with trypsin, and represents each peptide ion by its highest scoring identification.
Hovering over a point will bring up a tooltip with run details. The mean (indicated by pinch-arrows) and error bars are also provided (+/- 1 SD) for conditions. When you hover over the error bars in one condition, they will be superimposed upon the others for comparison.
An unusually high proportion of missed cleavages may indicate problems with trypsinisation, and notable differences between any digestion batches would be worthy of investigation. It should also be noted that identification parameters (for example, missed cleavages allowed) will naturally affect this chart, limiting the potential values taken.
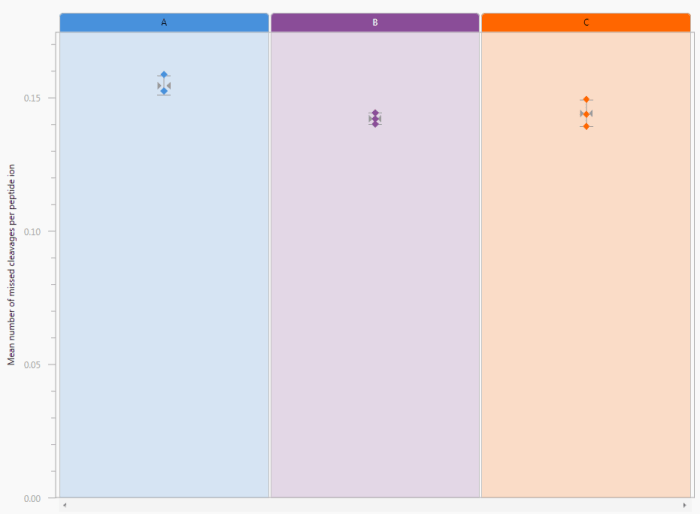
The (Sample preparation metrics) Missed cleavages chart. In this case, three conditions are being compared, with every run plotted individually but runs clustered by condition.