


How does Hi-N work?
Hi-N in Progenesis QI for proteomics is an implementation of Hi-3 as described by Silva et al. [1]. After peptide and protein identification, the abundance of each peptide is calculated from all its constituent peptide ions. For each protein, the N most abundant peptides (N being set according to the user selection) have their abundances averaged to provide a reading for the protein signal. In Progenesis QI for proteomics, the ranking of peptide abundance is based on the integrated value across all the runs, allowed by the lack of missing values and accurate alignment. This gives added confidence in the peptide selection, taking all runs into account to make the ranking robust.
This averaged reading allows relative quantitation of the same protein across runs. With the inclusion of a known amount of a calibrant protein in each run, this can be converted to an absolute reading for protein amount. This is achieved by nominating the calibrant at the Protein options dialog at the Resolve Conflicts or Review Proteins windows. The amount-to-signal ratio derived for this protein is applied to all proteins, allowing absolute quantitation within and across runs.
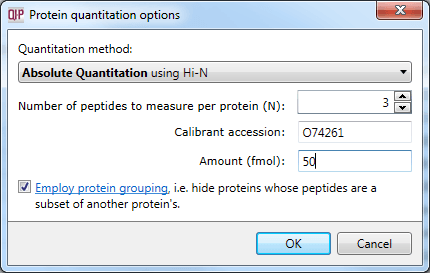
Setting the calibrant accession and amount.
The calibrant is stabilised to correct for errors in its loading (more detail is available here) which ensures that the estimation is as robust as possible.
What happens when some of the N peptides are not unique to the protein?
When there are peptide conflicts (a peptide is shared between two proteins, for example) it is important to assign the signal correctly for absolute quantitation. To do this, Progenesis QI for proteomics carries out a two-step process. Firstly, Hi-N is carried out only on the N most abundant unique (non-conflicting) peptides of the proteins concerned. This provides a ratio estimate for the two proteins based only on unshared peptides. The abundance of any shared peptides is then divided and allotted in this ratio between the two proteins, and the full Hi-N calculation then applied using the divided values for conflicted peptides. Naturally, if the conflicted peptides are not among the N most abundant in either protein initially, then this will not cause any difference in the result.
What happens when the protein has fewer than N identified peptides?
The value N is a maximum. For example, with N set to 3, if there are fewer than three peptides identified for a protein, all peptides will be used; the algorithm does not exclude proteins with only one or two peptides. This means that fewer readings will be used for the estimation of protein abundance (which is why the average, not the sum, is used in calculation).
If interested, one can read off the number of peptides used for quantitation at the Review Proteins window. The simplest method is to read off the number of peptides identified from the Peptide count column, for example 12 for the highlighted protein Q5ADN7 below. If N is less than or equal to this value, then N peptides will have been used; if it is higher, then the number of peptides present will have been used.
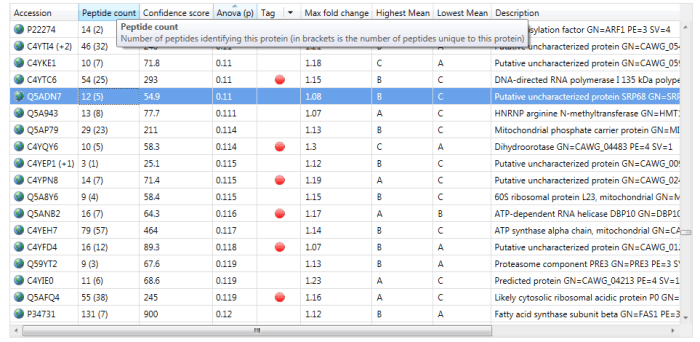
The Peptide count column in the Review Proteins window. For the selected protein Q5ADN7, 12 peptides have been identified, of which 5 are unique / non-conflicting.
To determine which peptides were used, one can double-click on a protein’s row in the table or select the view peptide measurements button on the side bar, whereupon the more detailed peptide measurements table for the protein is brought up. In this table, black circles in the first column (marked ∑) indicate the peptide ions used in quantitation.
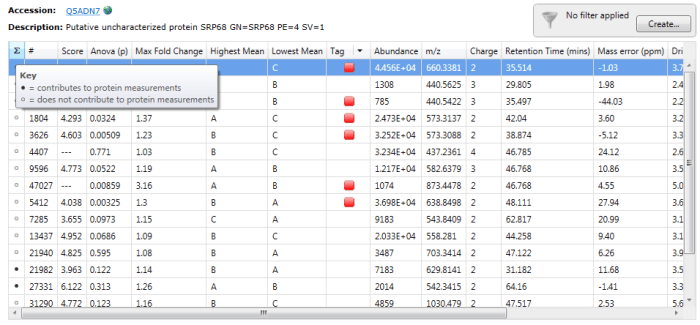
Black circles designate peptide ions and peptides used in quantitation when you double-click on a specific protein. For the example Q5ADN7, peptide ions 21982 and 27331 are among those belonging to peptides used for quantitation.
Alternatively, one can export peptide measurements, which will include a column detailing the species used for quantitation.
Waters MSE data
Note that for Waters MSE data, both 'pass 1' and 'pass 2' identities are potentially included in the Hi-N calculation, although naturally the most abundant peptides are likely to be pass 1 data. This is a slight alteration in approach from PLGS.
Reference
- Silva et al., 2006: "Absolute quantification of proteins by LCMSE: a virtue of parallel MS acquisition." Mol Cell Proteomics 5 (1):144-56.
See also
- When using absolute quantification by Hi-N, why are the calculated amounts of my calibrant protein not equal to the value I enter?
- How can I see which peptide ions contribute to my protein's measurements?
- How will peptide deconvolution affect my identifications?
- How does Hi-N work in the fractionation workflow?