


How do I use the QC metrics screen?
Progenesis QI for proteomics includes a number of batch-based QC metrics which you can examine to increase confidence in, or identify issues with, your data. These views are presented at the QC Metrics page. By setting up experimental groupings that correspond to your batch metadata, you are able to investigate whether there are any systematic effects associated with your processing. This gives you confidence that your conclusions are not affected by technical biases within the course of the experiment.
The charts are updated with changes in your active experiment design. This allows you to examine the effects of all stages of your processing if you wish, using different batch divisions. Some charts also allow you to investigate biological differences, such as abundance profiles and protein modifications.
Metrics
There are two sets of metrics. Firstly, the Overview page provides nine at-a-glance summary measurements which cover the experiment as a whole:
- Identifications overview
- LC peak width
- Peptide ion dynamic range
- Precursor m/z
- Precursor retention time
- Mass errors
- Precursor charges
- Missed cleavages
- Peptides per protein
Then, the remainder of the pages provide more detailed information and bring in batch-by-batch and run-by-run detail, some of which builds on the overview charts:
- Sample preparation metrics - highlighting issues or problems with the preparation of your samples:
- Instrument metrics - highlighting whether your chromatography column and mass spectrometer are configured and performing correctly:
- Experiment metrics - concerning the identified proteins and peptides in your experiment, allowing you to pick out any outlying runs or conditions:
For details of each metric, please follow the relevant link. The metric is described, hints are provided for interpretation, and a representative image is provided.
Interpretation
It is worth noting that there is no simple 'right' or 'wrong' answer as to whether your data are of high enough quality. QC measurements are designed to flag up potential issues for investigation, but there must be an assignable cause to the variation observed to render QC practical [1]. We are always happy to provide advice where we can, of course! Clearly, however, you might be concerned if the detailed batch-by-batch views show notable changes in your data with processing.
Furthermore, the QC metrics will be rebuilt if you delete and re-do any stages leading up to them (for example, clearing identifications and re-searching with changed identification parameters, or altering the alignment). Hence, if you archive your experiment before and after your changes, or export the charts before and after, you can see the effects of your changes upon the quality measurements – a very useful method for assessing your interventions.
Flagging
You can also tag metrics of interest or concern with a comment; flags are saved with the experiment for your records. To do this, click the empty flag icon in the tab header for the given metric (or in the tile header on the overview screen):


This will raise a dialog box, allowing you to enter a comment describing why the metric has been flagged. Comments entered are also saved with the experiment.
Reporting
You can export a QC report for your own records, or to pass on to another member of your team, using the option on the sidebar:
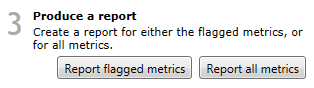
Report all metrics generates a report containing all metrics shown in the application (overview, sample preparation metrics, instrument metrics and experiment metrics).
Report flagged metrics generates a report of only metrics you have flagged, along with the message you entered on flagging the metric (if any).
Alternative approaches to the QC metrics page
QC Metrics is the first of two approaches that Progenesis QI for proteomics enables for QC. It is also possible to export your raw and normalised data as a csv file, allowing you to plot control charts over time for analytes of interest, all analytes or even correlated analytes corresponding to specific multivariate technical effects that may have been identified in your system characterisation studies. These could be peptide ions, peptides, proteins or even contaminants you wish to monitor. More information on this type of approach for proteomics data is available elsewhere [1-3].
References
- Bramwell, 2013: "An introduction to statistical process control in research proteomics." J Proteomics 95: 3-21.
- https://www.westgard.com/westgard-rules/. A useful resource describing control chart analysis and the application of ongoing quality control.
- Jackson, D. and Bramwell, D., 2013: "Application of clinical assay quality control (QC) to multivariate proteomics data: a workflow exemplified by 2-DE QC." J Proteomics 95: 22-37.