


Should I use enrichment or over-representation analysis for pathways data?
Pathways analysis tools commonly offer you the option of using multiple statistical tests to identify differentially regulated pathways between biological conditions. Commonly, these include enrichment or over-representation analyses; et al. [1] and shown below:
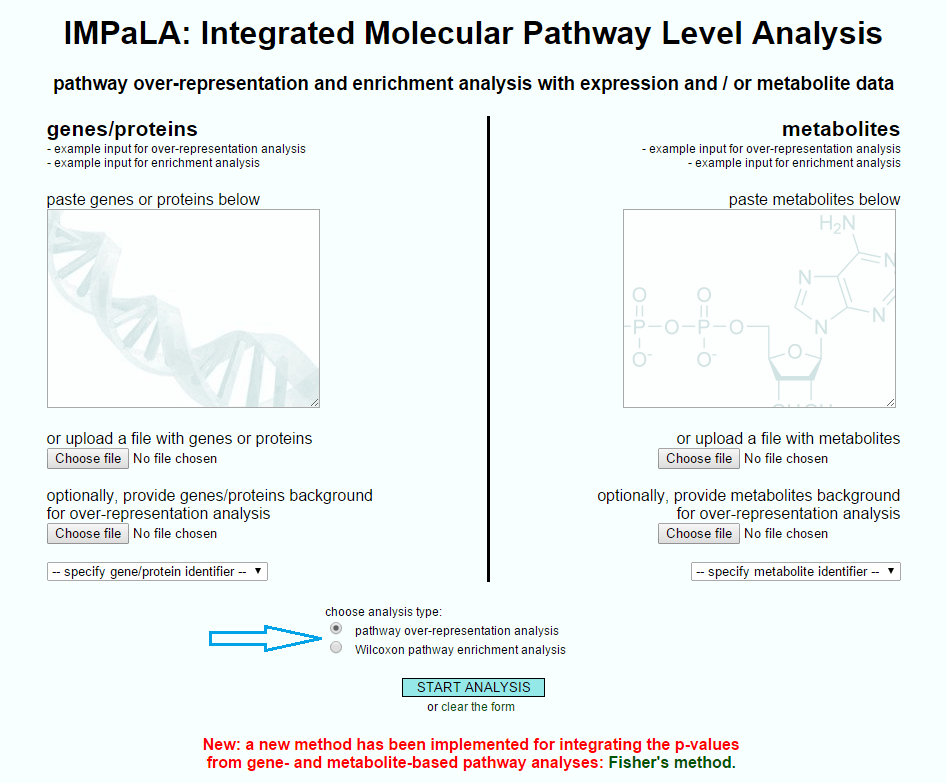
The two types of statistical test offered by IMPaLA.
The exact tests offered may depend on the pathways analysis tool you are using. It is also important to note that there is a wide range of tests that can actually be carried out, and this FAQ is very much a simplification; a recent discussion of pathway analysis methods in cancer genomics forms part of Afsari et al. [2] and gives a more detailed overview of the evolution and use of these tests. However, in the case of IMPaLA as a specific example, these tests cover two principal uses.
Over-representation analysis
- Requires a list of metabolite identifiers. It analyses whether the list you supply is significantly associated with a particular pathway or set of pathways (that is, localised to certain pathways or classifications, instead of randomly scattered throughout the whole set of possible pathways). Therefore, you should have already selected a list of identifiers of interest, which are a sub-set of all the metabolites you can/have measured. These metabolites of interest might be those significantly different between your experimental conditions, for example.
- You have the option of also supplying the entire list of measurable metabolites as a background list (see the link in the summary section), which is advisable.
- This test is relatively quick, as it is only testing a sub-list of metabolites. However, it relies on you having selected a sub-set appropriately, and all metabolites on the list are treated as equally important by the test (which might not be the case if they are actually altered by very different amounts, for example).
The IMPaLA-provided example input for over-representation analysis is shown below, showing the simple list-based nature of the input and the optional background upload.
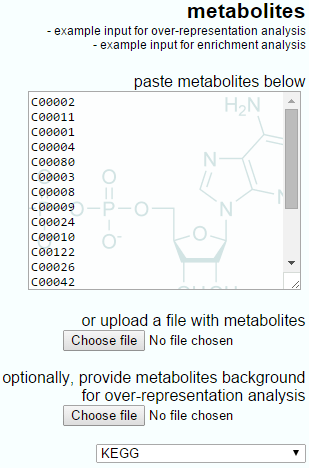
The example input for over-representation analysis provided by IMPaLA.
Enrichment analysis
- Requires an export of your full metabolite feature set, along with an expression measure for each metabolite reflecting its difference between two states (in the case of Progenesis QI, this will be the log fold-ratio between two conditions' mean normalised abundance for each compound, with up-regulation expressed as a positive value and down-regulation expressed as a negative one). This analysis considers these values for all metabolites, but tests for trends in the metabolites comprising each pathway, looking for a significant co-ordinated effect across all the relevant ratios to test whether the pathway is being up- or down-regulated in a manner that is unlikely to be accounted for by random chance. The Wilcoxon test is a rank-based one, using the ranking of the enrichment ratios over the set rather than their absolute values.
- This test is a more hypothesis-free approach, in that you have not preselected the metabolites of interest, and also the relative extent of between-group differences is taken into account for every metabolite. However, it is a more complex analysis and may take longer, because all metabolites are being considered.
The IMPaLA-provided example data and a Progenesis QI export for enrichment analysis are shown below. Note that the IMPaLA example shows expression data across groups; however, the test will also work with single ratios as the input, as is performed by Progenesis QI.
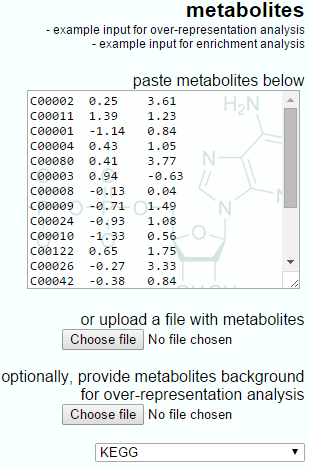
The example input for enrichment analysis provided by IMPaLA.
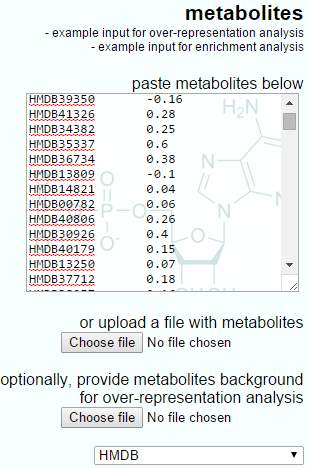
The Progenesis QI output to IMPaLA will have only two columns, the metabolite identifier and the log fold-ratio between groups.
Summary
Over-representation analysis looks at whether a subset of metabolites that you have already separated out associate significantly with certain pathways, whereas enrichment analysis takes differential data from every measured metabolite and looks for pathways displaying significantly co-ordinated shifts in those values.
More detail is available for IMPaLA in the supplementary information for Kamburov et al. [1], including tips for the use of a background list for over-representation analysis, and the details of the formulae use to make the two calculations.
References
- Kamburov et al., 2011: "Integrated pathway-level analysis of transcriptomics and metabolomics data with IMPaLA". Bioinformatics 27: 2917-8. DOI: 10.1093/bioinformatics/btr499.
- Afsari et al., 2014: "Learning Dysregulated Pathways in Cancers from Differential Variability Analysis". Cancer Informatics 13(Suppl 5):61-7. DOI: 10.4137/CIN.S14066.