


How are peptide abundances calculated?
The peptide outlines mark the boundaries of each isotope that forms part of the peptide. The peptide abundance is the sum of the intensities within the isotope boundaries. In the example below the blue shaded areas are used when calculating the abundance of that peptide.
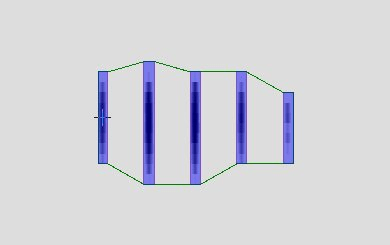
Blue shaded areas are included in the abundance
This means we can separate out the abundances of overlapping peptides, as shown in the example below.
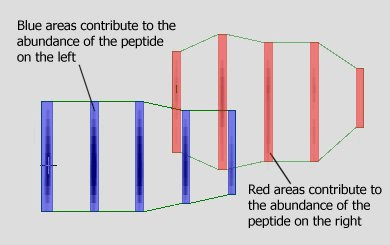
The abundance of overlapping peptides