


What is the relevance of the Peptides per fraction chart
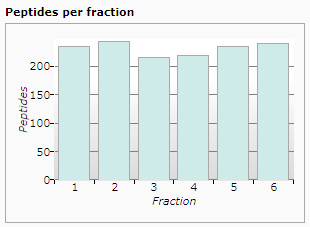
On the Import Data screen, a graph in the bottom left corner of the window shows how many peptides were identified in each fraction. Ideally, the peptides would be evenly distributed across the fractions.
If the majority of peptides have been identified in a small number of fractions, Progenesis QI for proteomics will alert you to this.
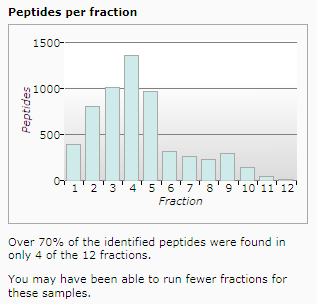
In such situations, the same quality of results could probably be achieved while creating fewer fractions.