


How do I use the QC metrics proteins per condition chart?
This Venn diagram shows the number of proteins identified uniquely in selected conditions and the number that are shared between them. Use the list on the right to select two or three conditions to explore.
This builds upon the Proteins chart to show overlap between the conditions. Primarily, it is a biological metric allowing you to investigate the similarity between conditions at the identification level, in addition to the quantitative multivariate metrics of the Protein Statistics window (although, of course, for repeats of the same sample this chart could give you an idea of the reproducibility of your identification process).
As with the Identifications overview chart, only quantifiable proteins are included.
Note that this chart does not take into account protein abundance or differential expression between conditions. It is purely based on whether a given protein was identified by MS2/MSE on any run in a given condition. The no missing values approach adopted by Progenesis may mean that a given protein was only identified (via MS2/MSE) on a single run (e.g. run A), but may have a non-zero abundance on another run (e.g. run B). For the purposes of this chart, such a protein would be considered identified only in run A.
Therefore, as with the Experiment Metrics Proteins chart, this chart may be affected if you limit the number of MS2 spectra exported per precursor to a small number relative to the number of runs at Identify Peptides.
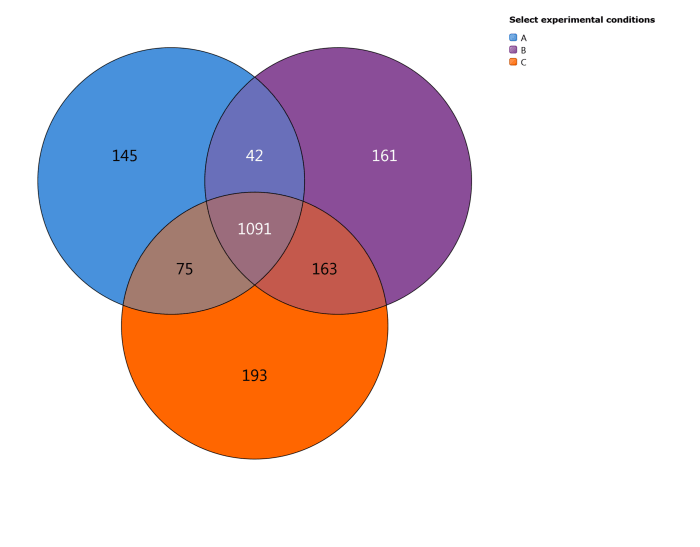
The Proteins per condition chart. This is a Venn diagram comparing two or three conditions simultaneously for overlapping and unique identifications.