


How do I use the fragmentation graphs?
If your data contains fragmentation information (either MS/MS or MSE), Progenesis QI will show you one of two fragmentation graphs, depending on your search method.
Mirror plot
This graph will be shown if:
- You have performed a search against an MS/MS database (e.g. an MSP file with Progenesis MetaScope or a LipidBlast search), and
- The currently selected identification was present in the MS/MS database.
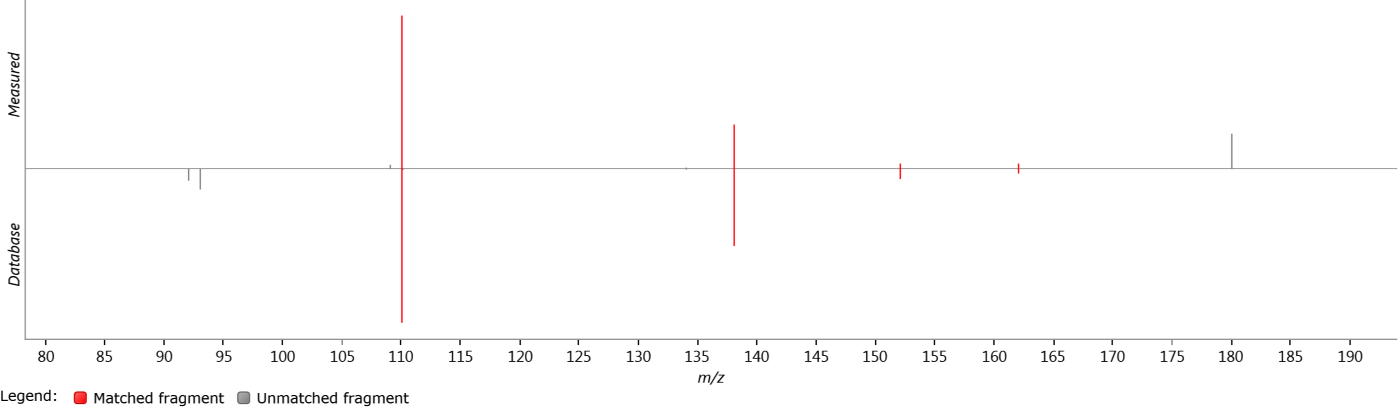
This plot shows the experimentally measured and database spectra on the same set of axes, for quick visual comparison. The positive y-axis shows an aggregate spectrum generated from all measured MS/MS spectra assigned to the selected compound. The negative y-axis shows an aggregate spectrum generated from all database spectra relating to the currently selected identification. The intensities of each spectrum are normalized to allow comparison of relative intensities.
Fragmentation plot
This graph will be shown when the mirror plot is not shown, i.e. in any of the following situations:
- You have not yet performed a search.
- You performed a search using no fragmentation method.
- You performed a search using theoretical fragmentation.
- You performed a search against an MS/MS database, but the currently selected identification was not present in the MS/MS database.
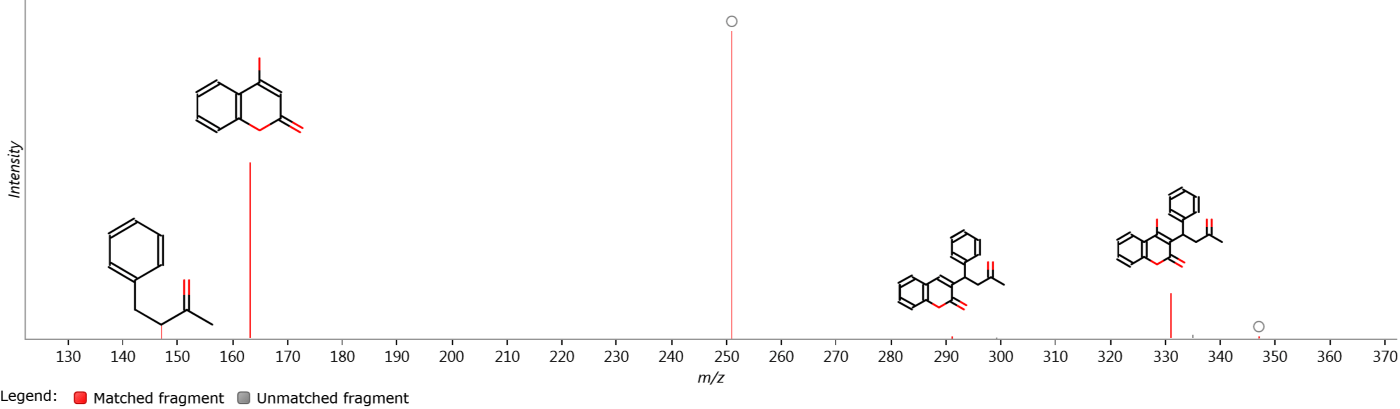
This plot shows an aggregate spectrum generated from all MS/MS spectra assigned to the selected compound. If you have performed a theoretical fragmentation search, it may also show matched theoretical fragments above the corresponding peaks (or if there is not enough space on the graph, a circle which will show the fragment when hovered).
Using these graphs
These graphs may be used for a variety of purposes:
- To give a qualitative picture of how well the selected compound's measured fragmentation pattern matches the selected identification's theoretical or empirical fragmentation pattern. Note that the fragmentation score provides a quantitative measure - see the FAQs for the theoretical fragmentation algorithm and the database fragmentation algorithm.
- To check for the presence of a given fragment in your data (e.g. for a certain lipid class you may always expect the head group fragment at a specific m/z).
- To assess the quality of fragmentation of your ions e.g. if your spectra are all showing a high intensity peak at the precursor and little other data, this might suggest your compounds are not being sufficiently fragmented.