


New features in Version 2.0 of Progenesis QI
Progenesis QI software enables you to Quantify and then Identify the 'small molecule' compounds that are significantly changing in your samples. With support for all common vendor data formats and a highly intuitive, visually guided workflow, Progenesis QI software helps you to rapidly, objectively and reliably discover compounds of interest using multi-group experimental designs, with the capability to handle the large sample sets typical of today's experiments. As well as conventional data-dependent analysis (DDA), Progenesis QI supports Waters MSE and HDMSE data independent analysis (DIA). Uniquely, the software also takes advantage of the additional dimension of resolution offered by ion mobility separations to give improvements in the accuracy and precision of compound identification and quantification.
New Features
Pathway Analysis: Discovery is nothing without understanding
Last year, we introduced the facility to perform Pathway Analysis into Progenesis QI for proteomics – and here, we extend this functionality to the ‘small molecule’ product Progenesis QI. One of the major bottlenecks in omics experiments is often the interpretation of the list of discoveries; what is the biological context of the changes observed in my samples?
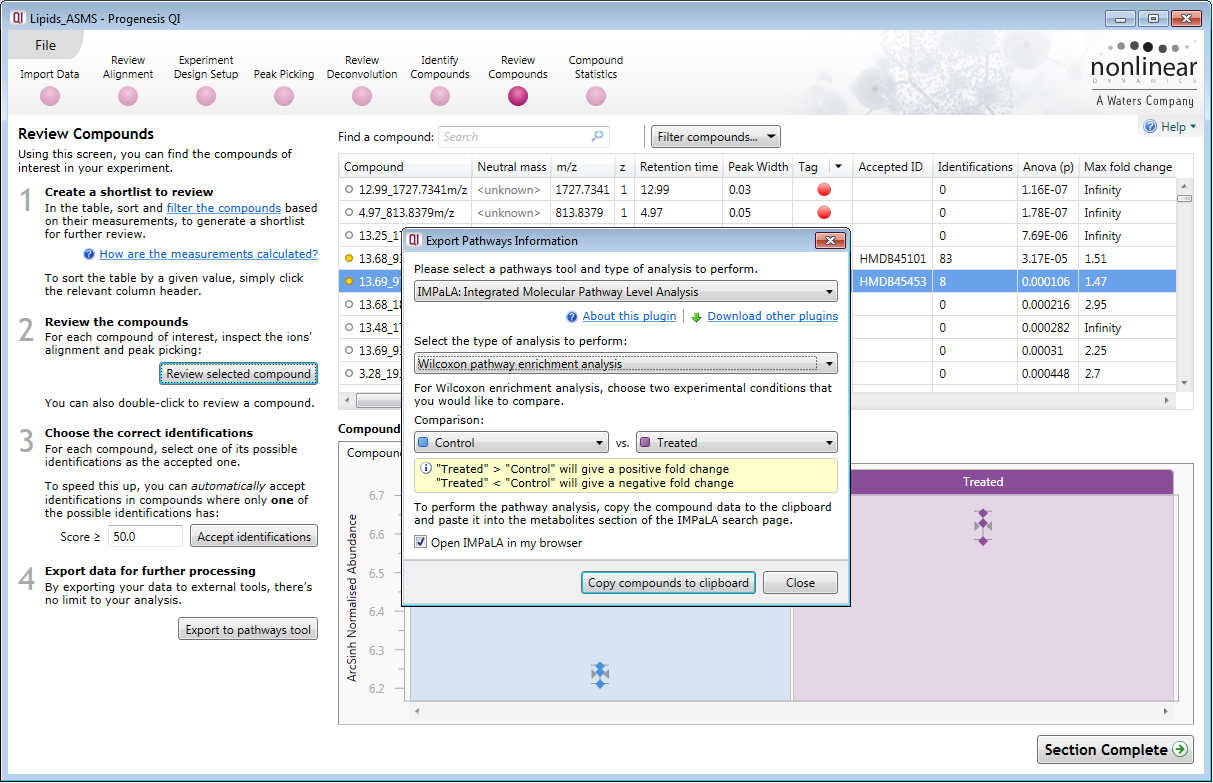
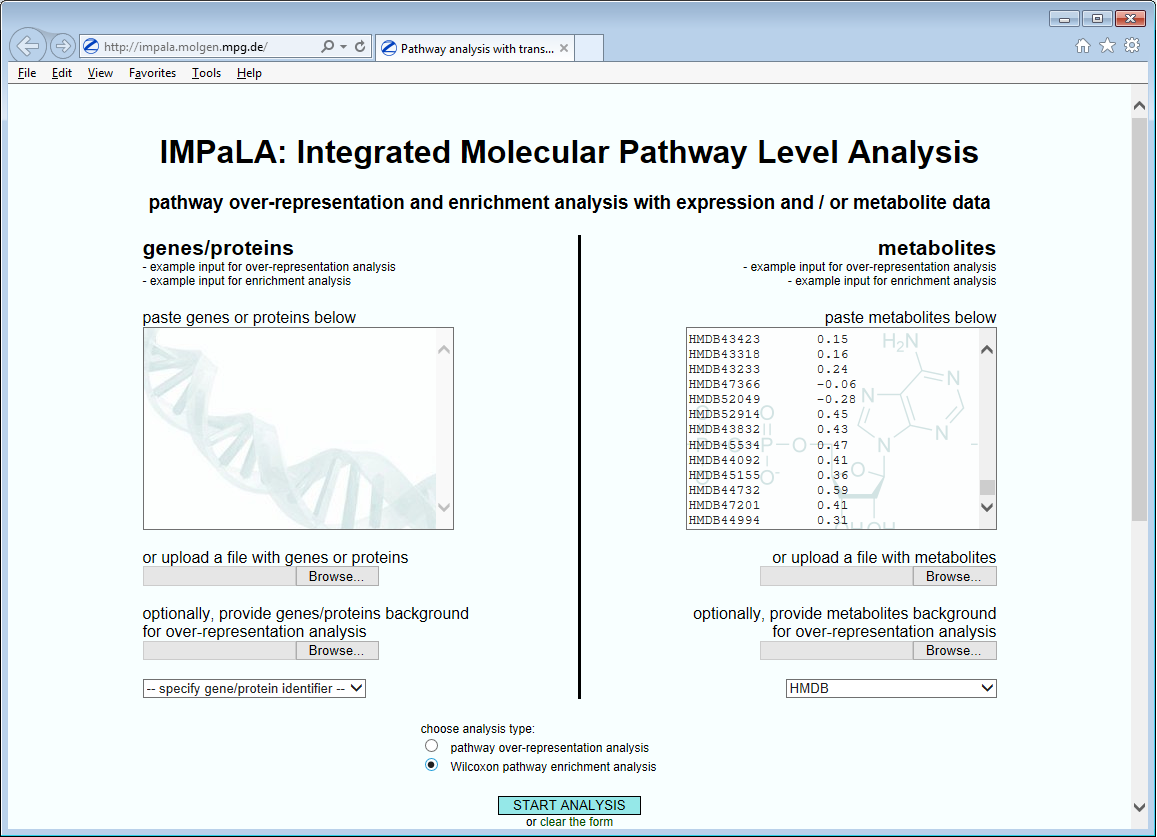
Pathway Analysis is one way to address this challenge and now it is possible to gain added confidence in the discovery of biological effects by using both protein and small molecule data in a single analysis. To achieve this, we have provided export tools to easily and quickly interface with third party Pathway Analysis programs.
![]()
![]()
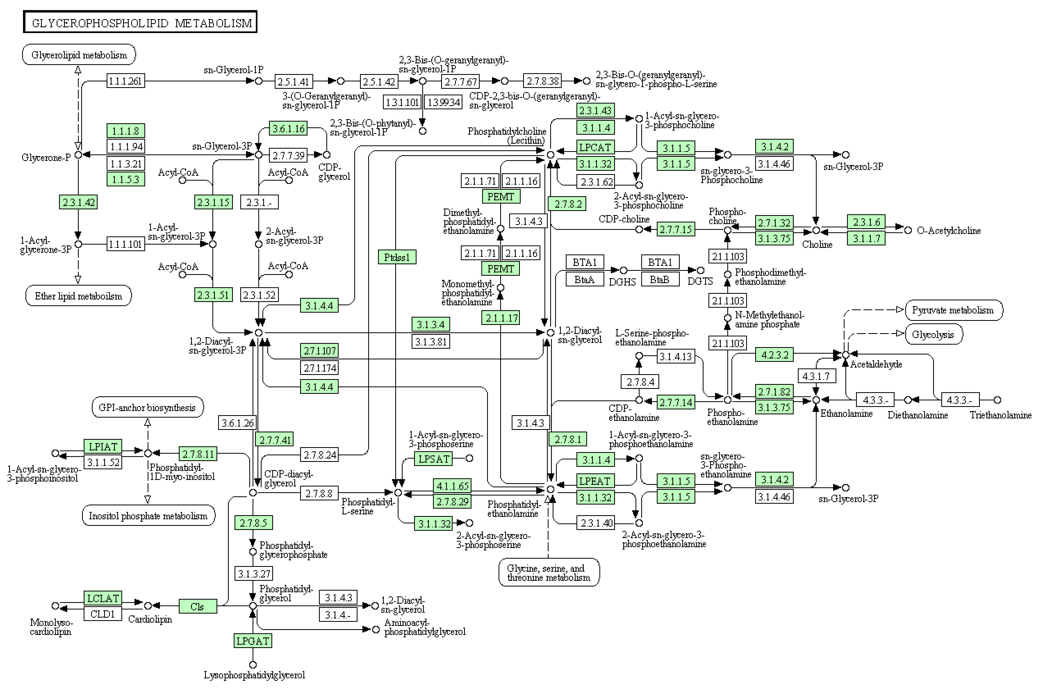
Easy export functionality to Pathway Analysis tools facilitates the process of placing discoveries into a biological context and extracting maximum value from omics data.
Process Automation: Saving you valuable time
To free up your time for other important tasks and maximize the opportunity for overnight and weekend processing, we have introduced additional functionality to enable the automation of many of the analysis steps. It is now possible, following Automatic Processing Setup, to move from Data Import to Compound Identification without any user intervention.
Improved access to compound databases: Increasing the opportunity for compound identification
Identification of small molecules remains a significant challenge and so, in addition to recently adding searchable parameters such as collisional cross sectional area (CCS) and fragment ion information, we have extended the range of databases that are searchable with Progenesis QI. The latest additions are LipidBlast and a complimentary license to search the 30 million compound structures available in the Royal Society of Chemistry database via ChemSpider.
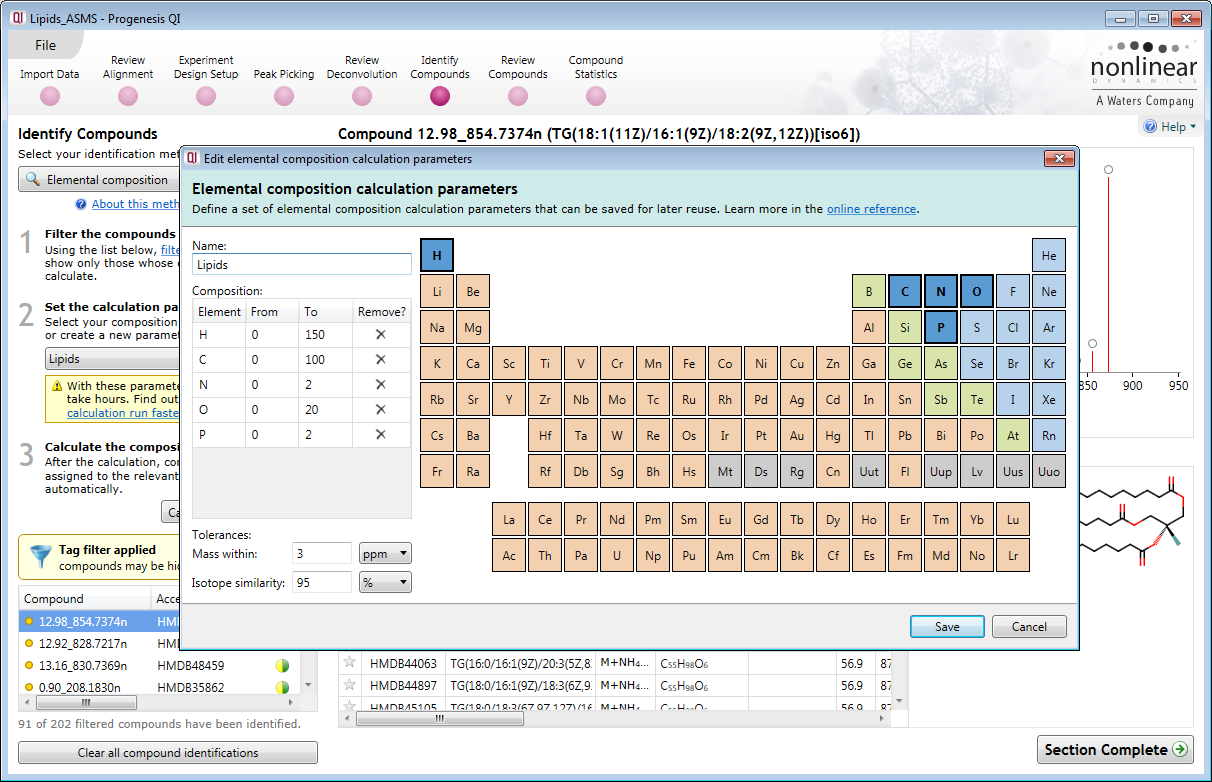
Elemental Composition: Obtain information about your compound when it is not present in a database
Despite the increased availability of compound databases, it is still possible that your compound of interest will not be found. Elemental Composition allows you to determine the elemental content of your compound whilst applying constraints to reduce the possibility of false positive results.
Seamless integration with extended statistics functionality in EZinfo 3.0.3
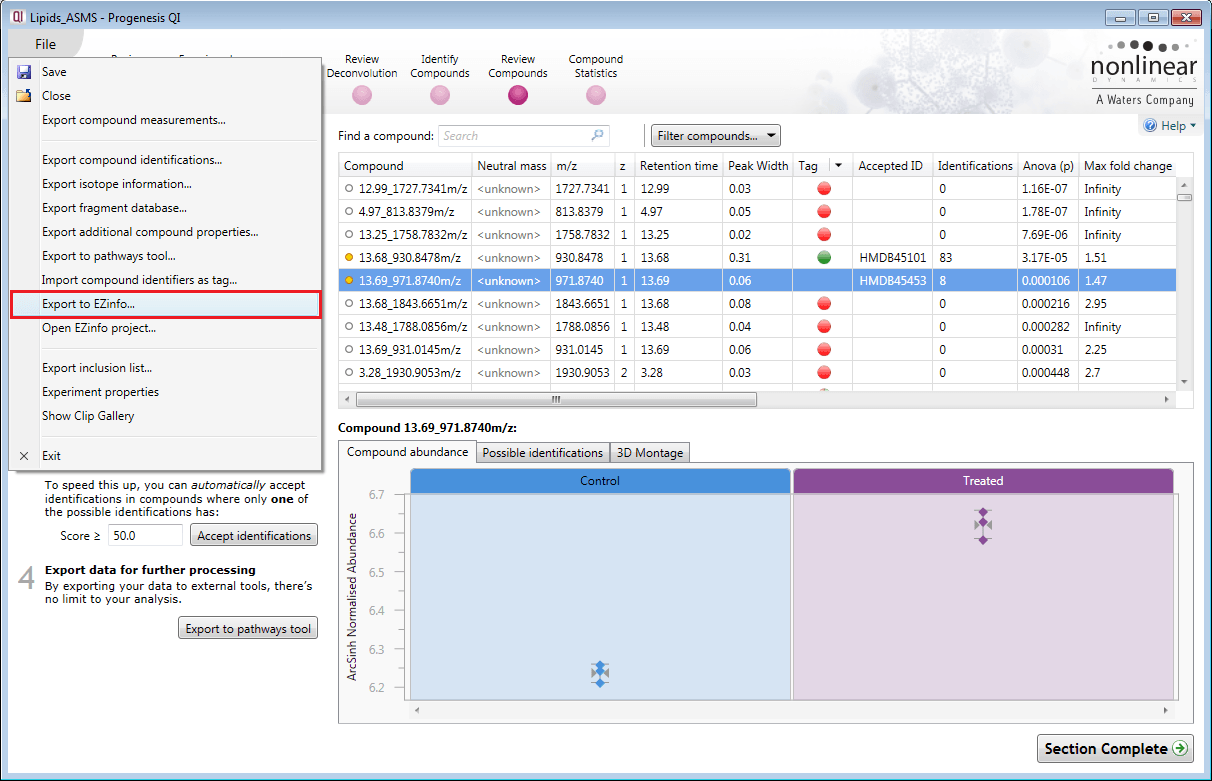
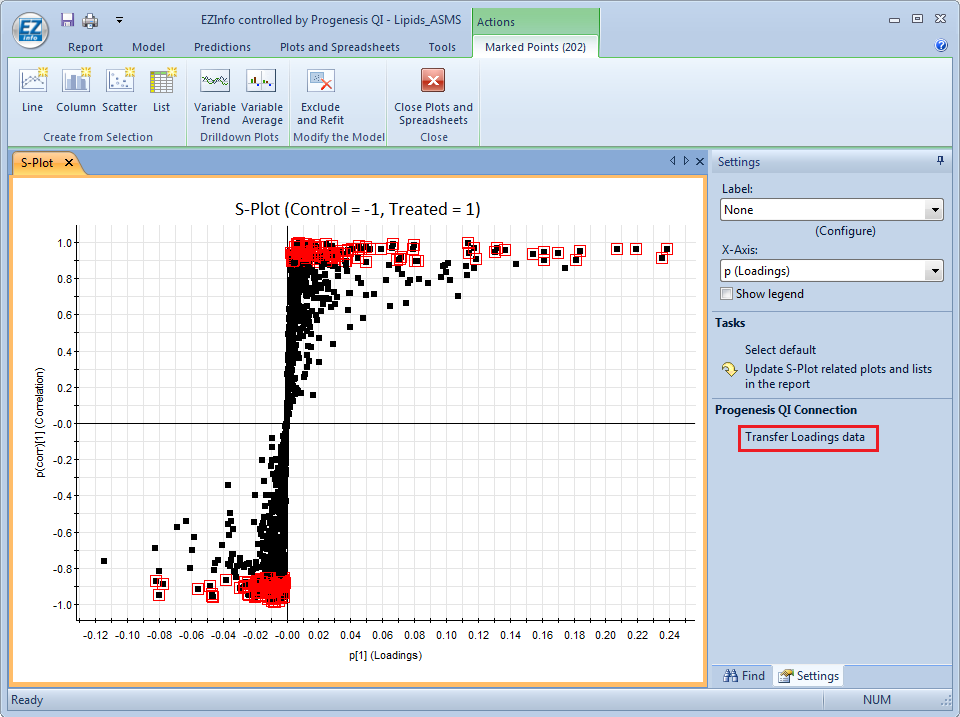
We have augmented the statistical analysis capability within Progenesis QI with the extended statistics module EZinfo 3.0.3, produced by Umetrics (Sweden). It is possible to export entire datasets or subsets to EZinfo, perform analysis, and import data back again to Progenesis QI for further investigation. All of this is achieved seamlessly with a single menu-driven command. In order for you to experience the benefit of this functionality, we can now provide an optional demo version of EZinfo 3.0.3 along with a Progenesis QI demo license.
![]()
![]()
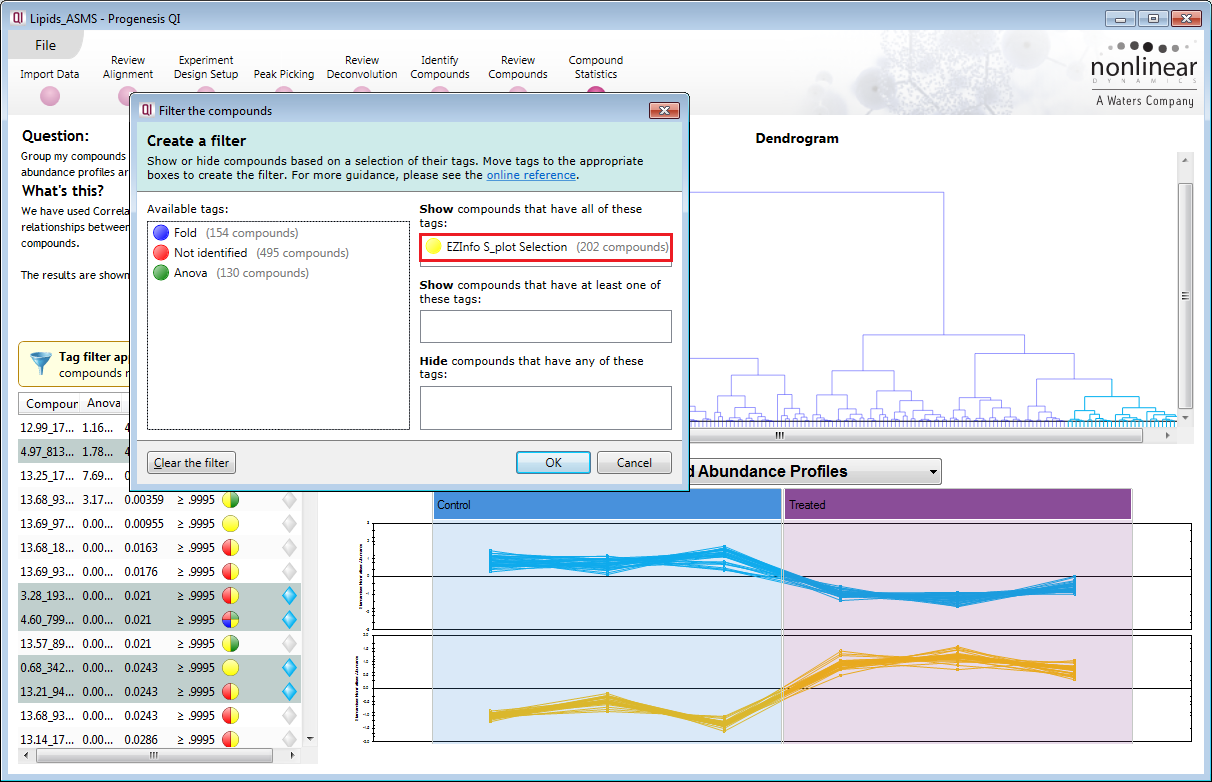
Entire datasets, or subsets of data, can be transferred between Progenesis QI and EZinfo to use techniques such as S-plot analysis to find differences between samples. Dataflow is two-way, enabling flexible data mining.