


How can I validate my compounds?
Note: The editing functionality has been significantly improved for Progenesis QI v3.0. If you are using an earlier version, make sure you read the version of this FAQ that is specific to your version.
Double-clicking on a compound in the Review Compounds screen shows the compound validation view. This view presents information about your compound and its adduct forms that allows you to confirm that their measurements are valid.
- A montage of ion maps helps to validate the ions' peak picking and alignment
- Graphs of mass spectra and chromatograms provide further confirmation of correct peak picking
Reviewing the compound
Review the compound's adduct forms one at a time, selecting the current adduct form in the list at the top-left of the screen; the ion maps and graphs will update to show the relevant ion's data. (You can also show the ion's location within the full ion map by selecting the Show Location option at the top-right of the screen.)
Below the list of adducts, a drop-down list lets you select whether you want to see the selected adduct:
- on the experiment aggregate
- across all runs, or
- only on runs within a single experiment condition
The Experiment aggregate option is most useful for validating the ions' peak picking, as the aggregate is generated immediately prior to peak picking and is used as the input to that process.
The other options (All runs and the experimental conditions) are more helpful for validating alignment, as they make it possible to see individual runs whose MS1 ion intensities are aligned inconsistently when compared to the other runs in their condition, or across the experiment as a whole. When using one of these options, you can use the Ion map layout options to control how many ion maps you can see:
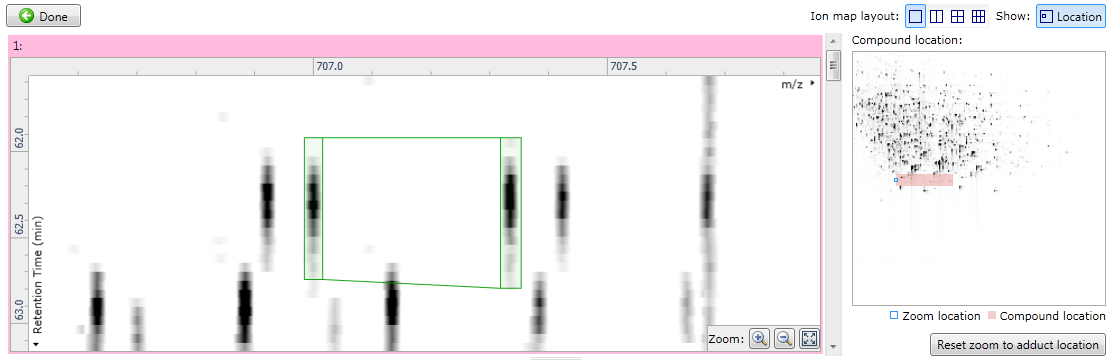
Fig 1: showing only a single large ion map and the location within the whole ion map.
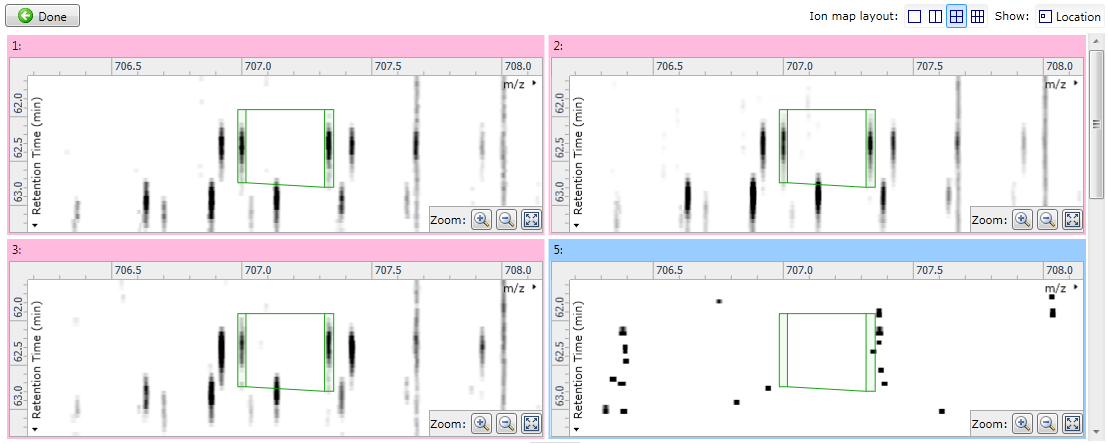
Fig 2: showing four ion maps simultaneously to allow comparisons.
Below the ion maps, the selected adduct's mass spectra and chromatograms are shown for the selected runs. Each line on the graphs corresponds to a single run, coloured according to the experiment condition to which it belongs. If you hover the mouse over a line, the name of the run which generated it will appear. When showing all runs, these graphs give further validation of how the adduct form's abundance is changing between experimental conditions.
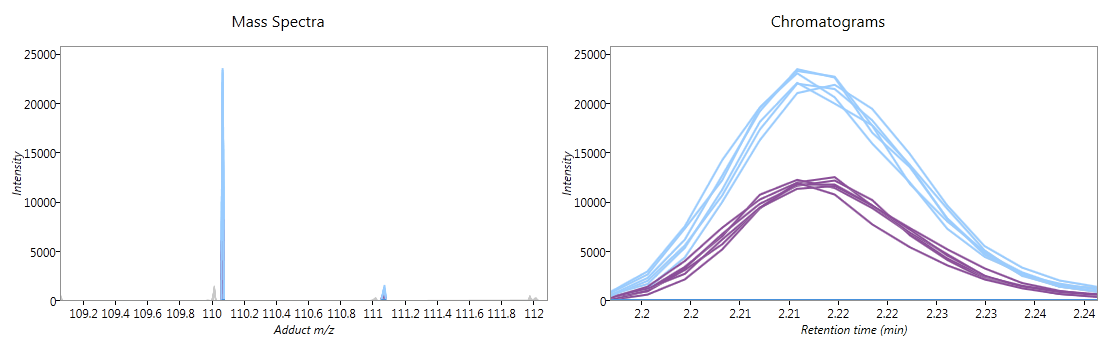
Fig 3: mass spectra and chromatograms
Editing the compound
The editing functionality has been significantly improved for Progenesis QI v3.0, and now has its own FAQ here.