![]()
Fundamental concepts in the TransOmics™ Informatics workflow
The workflow in TransOmics™ Informatics is designed to provide accurate measurement of the compounds in your samples in a way that allows robust statistical analysis and comparison across runs; the process is outlined here.
Importing your data
Prior to data import you are prompted to select from a list of possible adducts present in your samples. If a specific adduct is not listed it can easily be added to the list. This allows the software to automatically deconvolute compound ions detected later on in the analysis.
After being imported, each run in your experiment is represented as an ion intensity map (show me), or ion map for brevity, mapping the sample's MS signal by m/z and retention time. This gives an immediate visual quality check, highlighting any problems experienced in sample running.
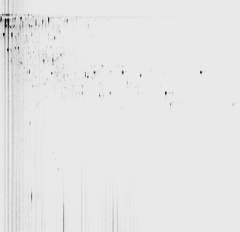
Alignment and quantification
These ion maps are then aligned in the retention time direction. From the aligned runs, TransOmics™ Informatics produces an aggregate run that is representative of the compounds in all samples, and uses this aggregate run for peak picking. The peak picking from this aggregate is then propagated to all runs, so you have the same ion detected on every run. This produces a complete data set, necessary for valid multivariate statistical tests.
Peak picking
You can optimise the peak picking parameters for each experiment prior to detection. The result of peak picking is displayed on an ion intensity map, so you can review this before committing to the final stages of data analysis. The peak picking algorithm detects compound ions in complex samples, including overlapping compound ions, which helps generate accurate quantification data.
Review compounds
This is where you review the results of quantification and identification together. All the compound ions are automatically deconvoluted to provide accurate compound quantitation. At this point, the focus turns to finding the compounds whose abundance shows interesting differences across the experimental conditions (e.g. treatment vs. control). This is based on variance, fold change and other compound measurements.
Identifying compounds
At this stage, TransOmics™ Informatics has deconvoluted and quantified the compound ions, but they have yet to be identified. MetaScope is a built in tool for searching your own database and returning results back into the workflow. The software can run a search of neutral mass or m/z and RT, with tolerances selected, against a flat file structure database. The identification results are then imported and automatically assigned to the relevant compounds. Depending upon the metabolite database used, your compounds may have been assigned more than one possible identification (show me).
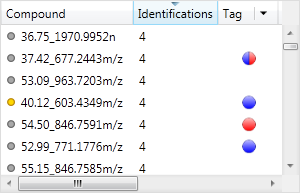
Review deconvolution
Here you can review all the compound ions, used to quantify and identify a compound, as a montage of detected features. Mass spectra and extracted ion chromatograms are also displayed for each compound ion, showing how similar they are. This is useful in visually checking the quality of data underlying each quantified compound.
If any compounds have an ion whose profile appears as an outlier in terms of its m/z and RT characteristics, within expected limits, it can be removed. Likewise, you have the opportunity to look if a compound ion appears at an expected position on the ion intensity map and, if it is present, add it to the compound quantification calculation.
Statistical analysis
Finally, you can export data to perform further analysis e.g. pathway analysis as well as explore your data in even greater detail with Compound Statistics. This includes Principal Components Analysis, Correlation Analysis, False Discovery Rate q-values and a view of how adduct abundance varies between runs.