


Support for Bruker Daltonics (.d)

About this plug-in
This is the standard format produced by Bruker Daltonics mass spectrometers. Each sample run is contained within a separate .d folder, which typically contains a file named either analysis.baf or analysis.yep.
Before installing
To use this importer you will need CompassXtract 32Bit v3.1.2 or later. If you do not have this installed it can be downloaded after logging in on the Bruker Daltonics' website..
Usage
To select samples to import, first click the Browse button:
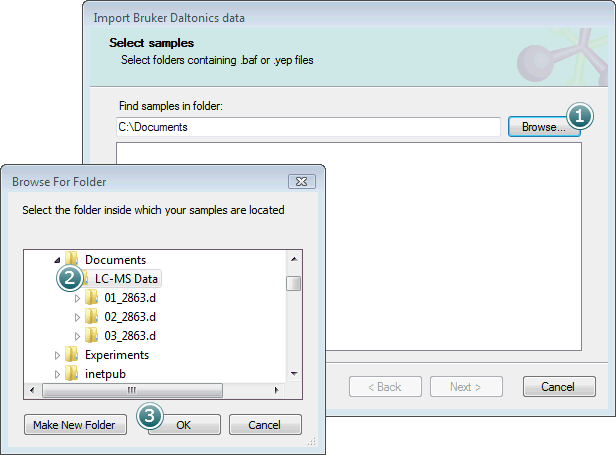
Select the parent folder containing your .d folders and click OK.
The .d folders within the parent will then be shown in the Select samples list box:
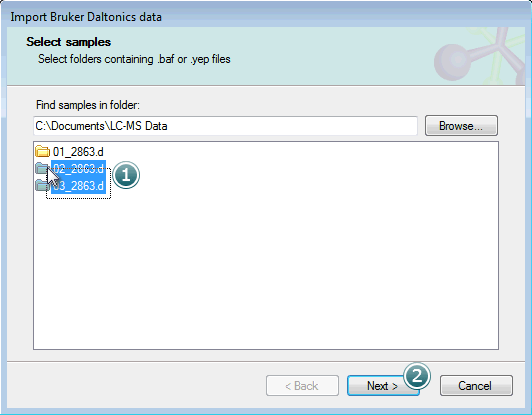
Select the samples you want to import and click Next to move on to the next step.
The next page allows you to include a linear m/z calibration as part of the import process:
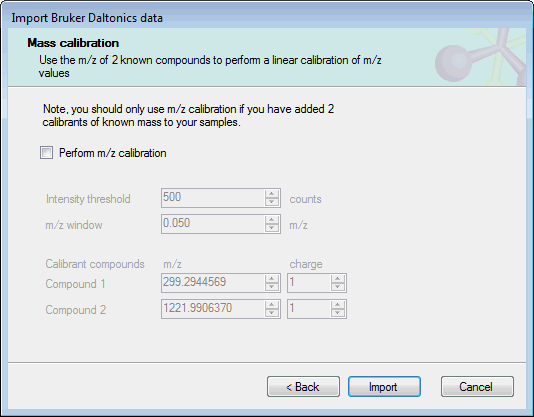
If you have included 2 calibrants of a known mass in your experimental samples, you can use these ions to calibrate the sample m/z values as they are imported. To do this, select Perform m/z calibration and set the expected m/z and charge for the calibrant ions. The other required option are:
- Intensity threshold: the minimum intensity in counts for a calibrant peak to be used in calibration.
- m/z window: the minimum m/z range over which the calibration algorithm should search for calibrant peaks.
If you do not want to apply an m/z calibration, clear the Perform m/z calibration checkbox.
Click the Import button to begin the data import.
Important Notes
Some Bruker data folders contain both centroided and profiled data for the same run. You can import such data into either a centroided or profiled experiment, but your results may differ slightly between the two.
QI for proteomics v3.0 has improved its data filtering for centroided Bruker data. Centroided Bruker data has already had noise reduction applied, so QI for proteomics now performs less filtering. This means that centroided Bruker data imported in QI for proteomics v3.0 will show more peaks that data imported in QI for proteomics v2.0 or earlier.