


When using absolute quantification by Hi-N, why are the calculated amounts of my calibrant protein not equal to the value I enter?
When you use a calibrant for absolute quantitation by the Hi-N method [1], Progenesis QI for proteomics carries out a stabilisation. This is designed to offset variation in the amount of calibrant added across the runs, and also allow the calculation of absolute protein levels in the case of a serious (outlier) calibration error. Taken together, these avoid the calculation of erroneous values as a result of variation in the spike-in process. However, the values for the standard may be adjusted from those that you enter in the process of achieving this. To illustrate this, the method employed is detailed below:
Method
The stabilisation is carried out as part of the first three steps below, before analyte amounts are calculated in the fourth.
1. Global normalisation
The global ratiometric normalisation is used to standardise the calibrant along with all the other analytes at the peptide ion level. Effectively, this is assuming that the calibrant should be remaining at the same level relative to the proteome as a whole, and that global shifts in signal will also affect the calibrant. This is the first stabilisation.
2. Relative protein abundance calculation
The relative abundance of a protein is then calculated after normalisation. This is the average of the integrated intensity of the N most abundant peptides for each protein across all their peptide ions as described here.
This provides the values for the normalised relative abundance of the calibrant protein across runs, termed in this FAQ:
P (abundance of calibrant) = P1, P2, P3... Pn for n runs
3. Deriving the relationship between relative and absolute amounts using the calibrant
The mean normalised calibrant abundance is then used to derive the relationship between loading and signal. The mean value is applied across all the runs, instead of using the value from an individual run's calibrant within that run. This assumes that your system is consistent across the experiment, and with that in mind, mitigates the effect of variation in the loading of individual calibrant spikes. The use of the mean is the second stabilisation.
(i) Mean normalised abundance of calibrant protein = M = (P1 + P2 + P3... + Pn)/n
Response factor, R, relating this to known absolute amount of calibrant per run, X, specified by the user:
(ii) R = X/M
This generates an absolute loading to signal ratio in normalised space, R, based on the calibrants across all the runs. This can now be used to calculate the absolute amount of other analytes.
4. Calculating the absolute amount of all analytes using this relationship
The absolute amounts of other analytes can now be calculated using this response factor and their own normalised abundances.
(iii) Absolute amount of any analyte A in any run: R * (normalised abundance of A in run).
Outliers
Note that a median absolute deviation filter is applied to the calculation of the mean in (ii) to remove the effect of outliers from the calculation. Also, where a sample is missing the calibrant, or has an outlying value, absolute amounts can still be accurately calculated as a result of this approach. The elimination of outliers is the third stabilisation.
Why does the calibrant value differ from that entered?
As the process shows above, normalisation, mean-based stabilisation and outlier exclusion are applied – three stabilisation steps using information from all runs to improve the accuracy of the data in every run. A consequence of this stabilisation is that the Review Proteins window may show values for the calibrant that are not precisely identical to the value you entered because the calibrant in that run is being adjusted by these steps. This is normal and intended; the data for your sample analytes should be improved by the process.
What if my samples are very different (e.g. a dilution series)?
Note that if you are loading samples that really do differ in their overall amount (for example a dilution series) but with the calibrant load specifically being equal in each run, then the first normalisation step would not be appropriate, so the first stabilisation should be avoided. This is because in such cases, normalising the calibrant along with the samples would increase its variance inappropriately.
This can be addressed by changing the global normalisation at the Filtering window to normalisation based on the calibrant only (the truly unchanging species across the runs). You should select Review Normalisation >> and the Normalisation Method tab, then select Normalise to a set of housekeeping proteins from the drop-down menu. Search on the accession of your calibrant and select the peptide ions relevant to it:
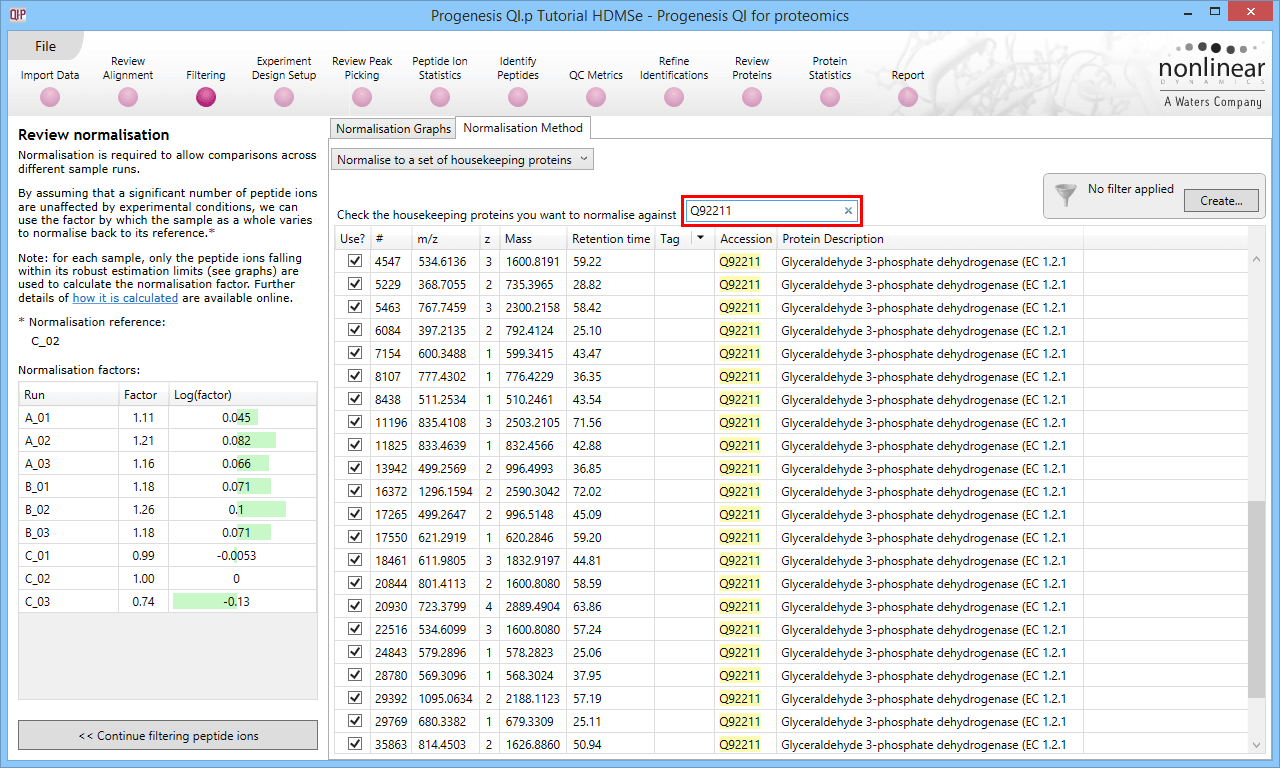
Normalisation to the calibrant only. In this case, Q92211 is simply a demonstrative example.
The mean calculation and outlier filter are still employed, for the benefits of stabilisation, but the normalisation is now carried out directly to the calibrant. This means the runs are relatively scaled correctly. Because this normalisation is done at the peptide ion level, the mean is taken, and outliers are filtered out, the values displayed for the calibrant in each run may still not be exactly identical to that which you enter, which is again to be expected, but the measurements are now on the right scale.
Reference
- Silva et al., 2006: "Absolute quantification of proteins by LCMSE: a virtue of parallel MS acquisition." Mol Cell Proteomics 5 (1):144-56.