


How are peptide correlation scores calculated?
When viewing the peptides or peptide ions of a protein at the Review Proteins screen, Progenesis QI for proteomics shows a correlation score for each peptide or peptide ion.
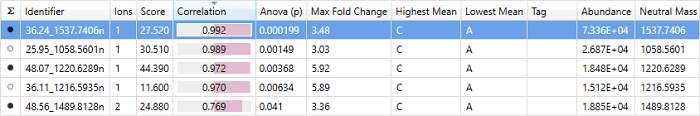 The correlation column in the single protein view at Review Proteins.
This score is a value between -1 and 1, and indicates how well the abundance profile of this peptide correlates with the other peptides in the current protein. A score of 1 indicates perfect correlation, i.e. this peptide changes in exactly the same way as the other peptides:
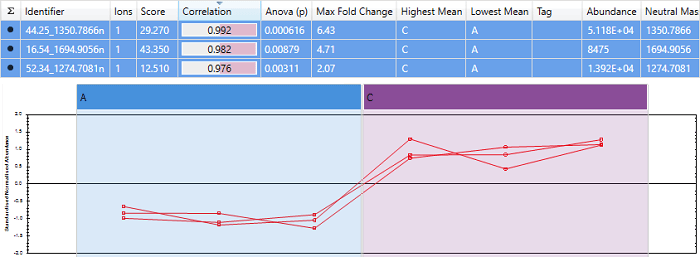 An example of a set of peptides with almost perfect correlation. Note that the scores are close to 1, and the expression profiles are very similar.
A score of -1 indicates perfect anti-correlation, i.e. this peptide changes in exactly the opposite way to the other peptides:
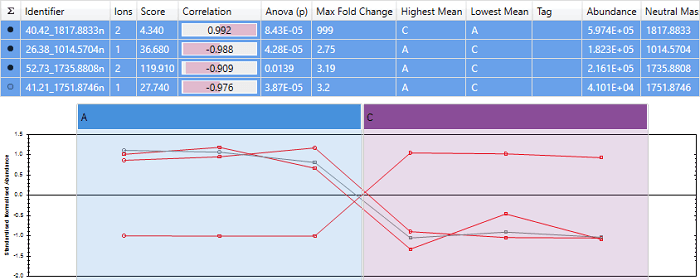
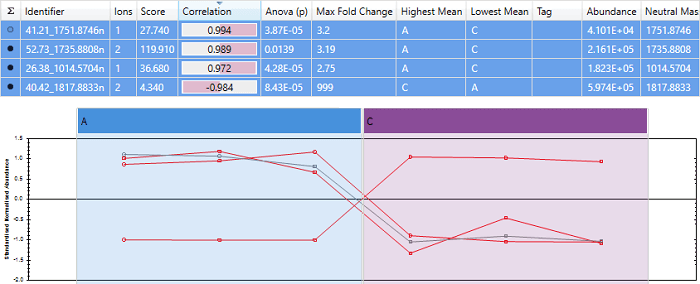 An example of a peptide with almost perfect anti-correlation. Note that the peptide "40.42_1817.8833n" has a score close to -1, and its expression profile is almost exactly opposite that of the other peptides.
The correlation score is based on a simple Pearson correlation co-efficient:
- Firstly, a mean abundance profile is calculated by taking the abundance profiles of all peptides in the protein, standardising them (converting to a mean of 0 and standard deviation of 1), then averaging these standardised profiles. The standardisation ensures that each peptide has equal weight in the mean abundance profile, so the overall abundance of a peptide does not affect the correlation scores.
- The correlation score for any peptide is then the Pearson correlation co-efficient between this mean abundance profile and the abundance profile of the given peptide.
The above explanation also applies when viewing the protein at the peptide ion detail level. In this case the mean abundance profile is over all peptide ions in the protein.
Why isn't the correlation against the protein abundance?
An alternative method of calculating the correlation score for a peptide might be to correlate the peptide abundance against the protein abundance profile. Progenesis does not use this method to avoid biasing the correlation scores based on their quantitation state. Here is an example:
Correlating to mean abundance profile
We are using Hi-3 quantitation, so the 3 most abundant peptides have been used for quantitation. Progenesis correctly shows that "40.42_1817.8833n" is anti-correlated, and the other 3 peptides correlate well.
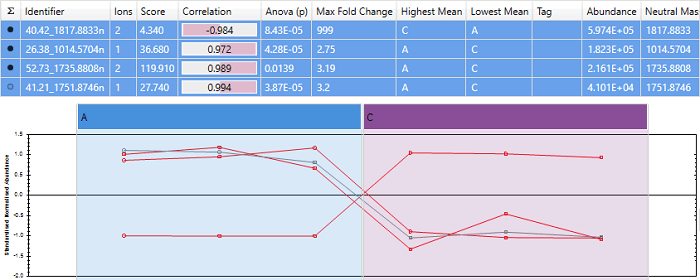
Correlating to protein abundance profile
In this case, "40.42_1817.8833n" gets a very high correlation score, and the other 3 peptides are shown as anti-correlated. This is because "40.42_1817.8833n" is the most abundant peptide, so influences the protein abundance profile heavily.
Since 3 of the peptides change in the same direction, and only "40.42_1817.8833n" changes in the opposite direction, it's more likely that "40.42_1817.8833n" is the outlier. Correlating to the mean abundance profile correctly identifies this.