


How do I use the QC metrics mass errors chart?
This chart shows the mass error for all identified peptide ions across all runs in the experiment, as a proportional distribution divided into binned ppm ranges. All errors above and below values near the edge of the distribution are combined together, to allow better resolution of the central region. For this chart, each peptide ion is assigned its highest scoring identification.
Given that identifications typically depend on user-adjustable parameters, a larger spread than expected may indicate that the search parameters used were too error-tolerant and too many identities have been assigned, potentially including false positives. Deviation from a mean peak of zero ppm could also indicate an instrument bias.
This is extended in the Mass accuracy chart in the Instrument metrics section.
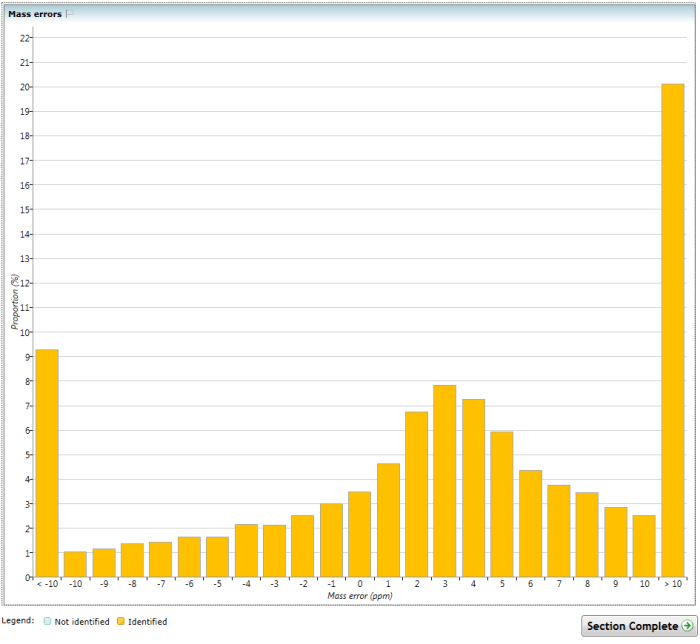
The Mass errors chart. Note that the extremes have high values because all values outside 10ppm in this case have been combined, allowing increased resolution of the relevant central region.
See also
- How do I use the QC metrics screen?
- How do I use the QC metrics overview screen?
- How do I use the QC metrics identifications overview chart?
- How do I use the QC metrics LC peak width chart?
- How do I use the QC metrics peptide ion dynamic range chart?
- How do I use the QC metrics precursor m/z chart?
- How do I use the QC metrics precursor retention time chart?
- How do I use the QC metrics precursor charges chart?
- How do I use the QC metrics missed cleavages chart?
- How do I use the QC metrics peptides per protein chart?