


How does database fragmentation scoring work?
To score database fragmentation matches, we use an algorithm based on the well adopted cosine similarity method. A similar method is, for example, implemented by MassBank [pdf].
Cosine similarity method
The dot product of two 2-dimensional vectors, and is:
It can also be expressed as:
Where is the angle between the two vectors, and .
By equating these two formulae, the "similarity" between the two vectors is given by the cosine of the angle between them, which has the nice property that it ranges from 0 to 1 when all co-efficients are positive:
This method can also be expanded to n-dimensional vectors:
A similarity of 1 means the two vectors are identical, and a similarity of 0 means they are orthogonal and independent of each other.
Cosine similarity method applied to ms/ms scoring
We apply this method to scoring of ms/ms database matches as follows.
We create two vectors and , where each element of the vector is a weighted peak intensity given by:
We combine all m/z's of peaks from the experimental and database spectra, and go through them in ascending m/z order. For each m/z, there are 3 possibilities:
- There is an experimental peak at the given m/z, but no matching database peak.
- There is a database peak at the given m/z, but no matching experimental peak.
- There is an experimental peak at the given m/z, and a database peak at the same m/z (to within a threshold).
For each of these scenarios, we add elements to the vectors and as follows:
- We add the weighted experimental peak intensity to and a 0 to .
- We add a 0 to and the weighted database peak intensity to .
- We add the weighted experimental peak intensity to and the weighted database peak intensity to .
Finally, we calculate the similarity metric on and as defined above. To obtain a score between 0 and 100, we multiply this result by 100.
Example
To illustrate this method, suppose we have the following experimental and database spectra:
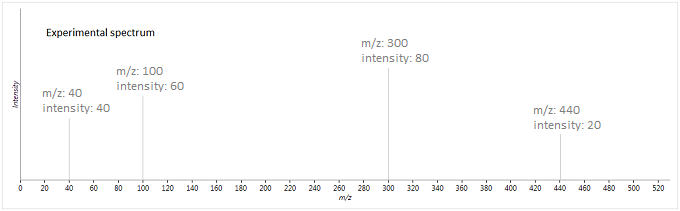
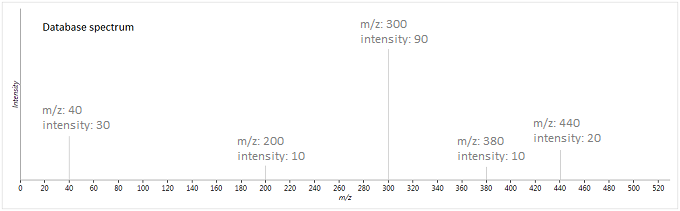
In this case, the two vectors produced are as follows (where is the weighted intensity function):
The similarity metric is then:
So these two spectra will be given a fragmentation score of ~93 - they are fairly well matched, but there are a few peaks which are either not matched, or not expected to be present, lowering its score.