

How can I use the mass profile and chromatogram to review deconvolution?
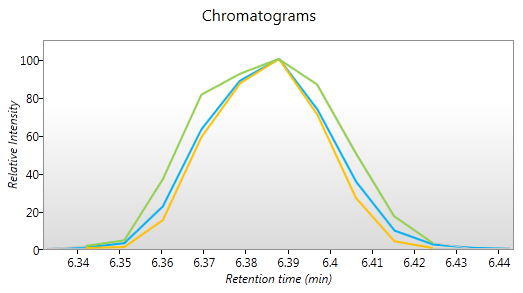
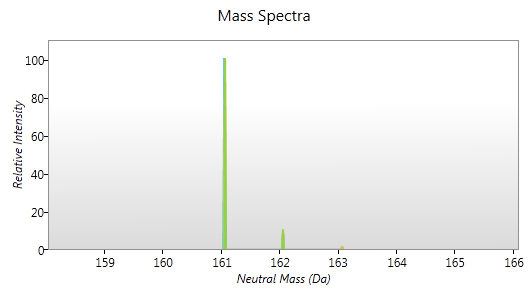
The bottom of the Review Deconvolution screen shows two graphs: mass spectra and chromatograms.
The mass spectra graph show the mass spectra of all the ions considered to be different adduct forms of the selected compound. The ions' spectra are shown de-charged and with their adduct mass removed so that they can be compared for similarity.
Ions that are truly adduct forms of the same compound should have very similar mass spectra. Any unexpected differences between the ions' masses or isotope profiles may indicate that the ions are actually different compounds and should be edited to reflect this.
Similarly, the chromatogram graph shows the chromatogram of each adduct form superimposed to allow you to check whether they appear to be from the same compound. Since ESI occurs after a compound elutes from the column, you would expect the chromatograms of the differently ionised forms to be very similar.